
MuleSoft Logging: Tutorial, Best Practices & Examples
Logging is an integral part of any software application, enabling developers to gain insights into the application by tracking events in a structured manner. Logging helps detect issues early in the development lifecycle and plays an important role in software debugging and system troubleshooting, allowing teams to trace failures back to their root causes.
MuleSoft provides standardized logging using Log4J2, a widely used logging utility for Java-based applications. This article discusses the fundamentals of logging in MuleSoft and ways to develop a robust, maintainable, and flexible logging framework for MuleSoft applications.
Summary of key concepts of MuleSoft logging
{{banner-large-graph="/banners"}}
Introduction to logging in MuleSoft
Logging is a core component of MuleSoft that provides developers with observability into how events are processed as they move through flows, connectors, and transformations within an application. It enables developers to capture information such as payloads, variables, and errors at specific points in application flows.
Built on top of the Log4J2 framework, MuleSoft logging provides granular control over log levels, formats, and destinations across environments.
Types of logs in MuleSoft
MuleSoft has two main types of logs from an application perspective:
- Runtime logs are ones generated by the Mule runtime itself. These contain information about the apps and the runtime lifecycle events. For example, whenever a Mule app starts or stops, a log entry is created in the runtime log file. By default, runtime logs are present in the Mule installation’s conf directory with the file name mule_ee.log.
- Application logs are generated by Mule applications. The application logs file contains application-specific information, including logs from explicitly added loggers in the flow and from other components. For example, if you add a logger to the Mule application flow to log the request payload, this log entry is added to the application log file. By default, the application log file is present under mule_home/logs/app_name.log. Each application includes a log4j2 configuration file that can be used to control and customize logging.
Synchronous and asynchronous logging
By default, MuleSoft adds log entries to files asynchronously. Asynchronous logging runs the logging task in a separate thread rather than executing it in the main flow thread. This way, when a process executing operations in a flow encounters a logging processor, it can create a new thread to handle it, ensuring that the main flow can be processed in parallel without waiting for the logging task to complete.
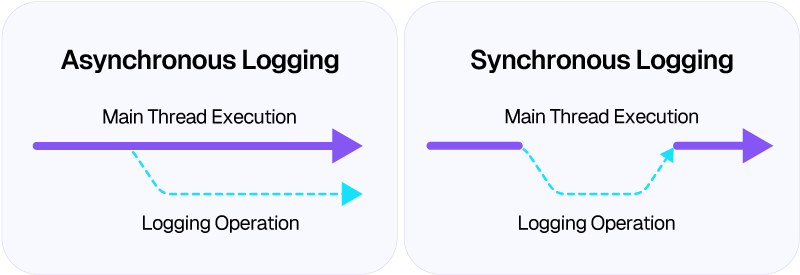
When logging synchronously, the main thread executing the flow waits for the logging operation to complete before continuing to process the next steps. MuleSoft recommends using asynchronous logging because it offers substantial performance benefits over synchronous logging.
Logging fundamentals
Log levels
Log levels define the severity and importance of log messages and control how much information is written to logs. In MuleSoft, log levels such as ERROR, WARN, INFO, DEBUG, and TRACE can be used to categorize messages by purpose:
- Error: This log level points to error conditions within an application that affect the normal execution of the flow. It signifies that the issue needs to be investigated immediately.
- Warn: This log level can be used to highlight potential issues within an application that do not affect the normal execution flow but can cause problems if ignored.
- Info: This log level can be used to log high-level information about application events, such as key processing steps, successful operations, and other relevant details.
- Debug: This log level provides detailed diagnostic information to help with debugging and troubleshooting during the development cycle. These logs can contain payloads that may help narrow down issues.
- Trace: This level offers the most granular level of logging, capturing step-by-step execution details for deep analysis and low-level debugging.
Log level hierarchy
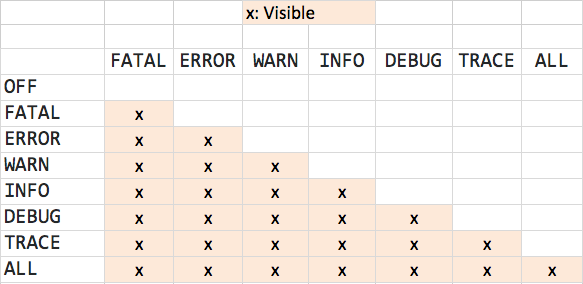
The log level hierarchy defines the order of log levels by severity and determines which log messages are recorded. In logging frameworks used by MuleSoft, the hierarchy is as follows:
FATAL → ERROR → WARN → INFO → DEBUG → TRACE
When a specific log level is configured, all messages at that level and higher severity are logged, while lower-level messages are ignored. For example, if the logger level for a package/category is set to INFO, all logs, including INFO, WARN, ERROR, and FATAL, will be logged. This hierarchy allows teams to control log verbosity by environment, enabling detailed logging during development and concise logging in production.
Logging categories
Logging categories help you segregate log messages by various criteria. They allow logs to be grouped and filtered by components such as specific flows, connectors, or modules. These categories let teams control logging in targeted areas in an application without affecting the entire application's logs.
Log categories are switches that can be used to toggle specific logs in the application associated with that category. For example, you can define separate categories for flows in an Mule application and control flow logs by turning them on/off in the Log4J config.
Understanding the Log4J configuration file
The Log4J config file controls how logging works in the Mule application and serves as the central place to define log behavior. Let’s look at the structure of the log4j configuration file and how to control application logging.
Appenders
This section defines where and how the application logs are written. Each appender can represent a destination for logs, such as the console, a file, or an external logging system.
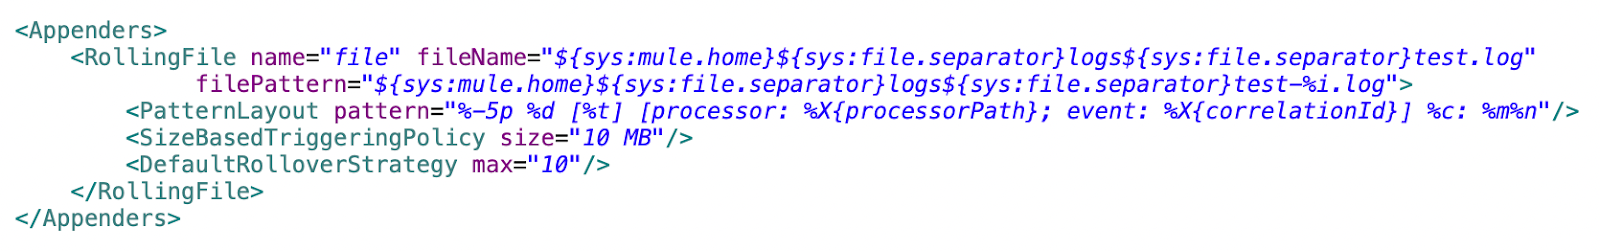
By default, MuleSoft uses a RollingFile configuration to write logs to a file and manage file rotation based on size. It also allows modifying the pattern used to add log entries to the file using the “pattern” layout.
Loggers
This section controls log categories and log levels for specific parts of the application. You can define loggers for different components in the application and control which messages are logged.
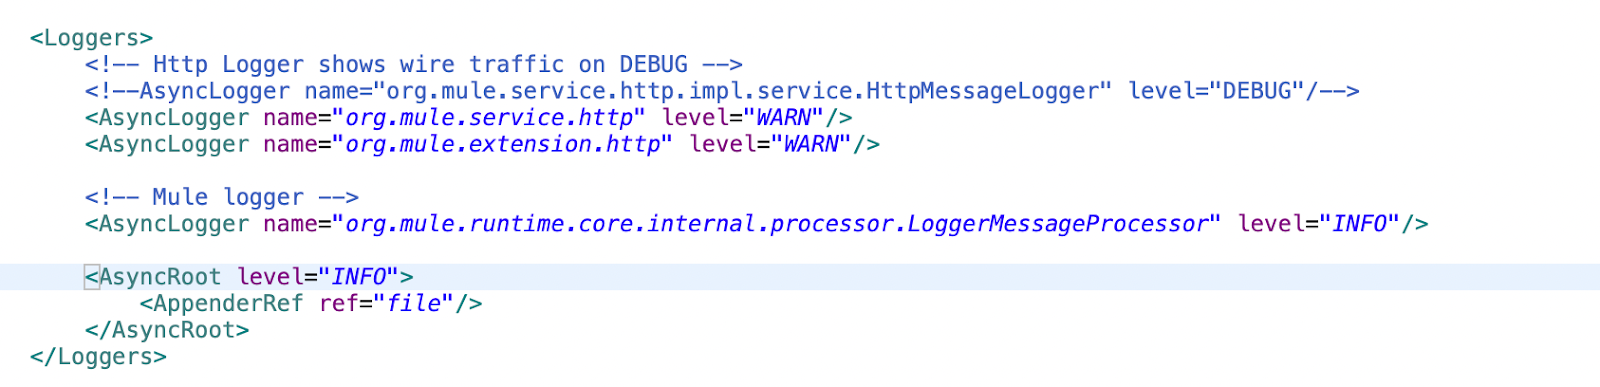
MuleSoft uses async loggers, which queue log messages for asynchronous processing rather than blocking the application thread.
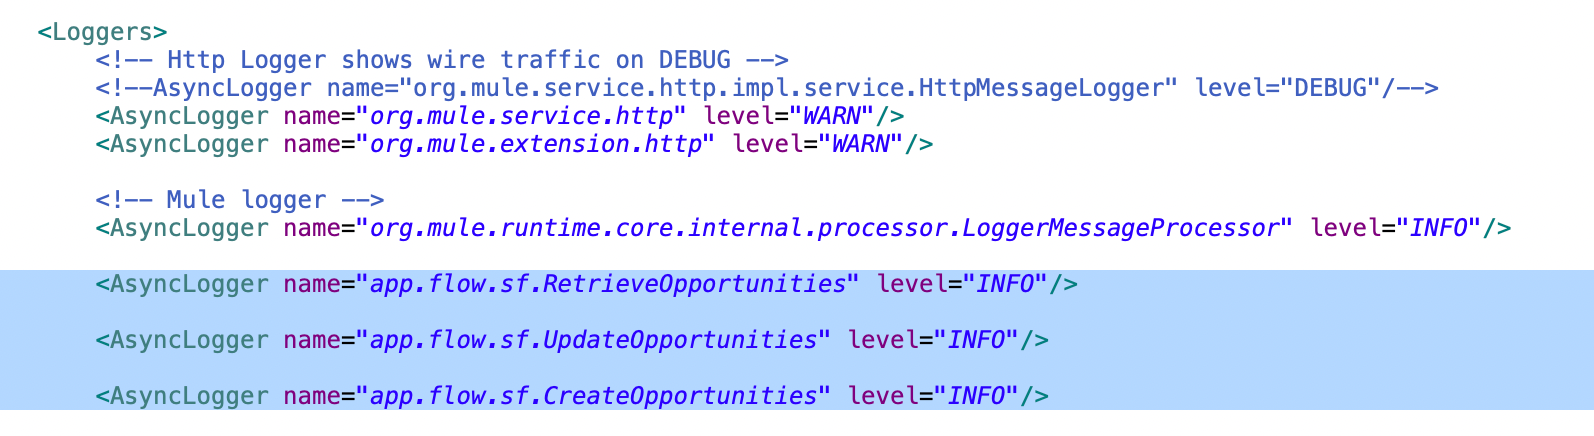
The AsyncRoot tag applies to all log categories that lack a specific logger. You can define a logger for a specific package or component using the AsyncLogger tag. The name field in the tag specifies the package or category name, and the level field specifies the logging level for that package or category.
For example, if you have defined a category for loggers in the retrieve-opportunities flow as app.flow.sf.RetrieveOpportunities, you can control the log level by adding the logger tag to the log config file. So if the flow has multiple loggers with different log levels, such as INFO and DEBUG, and you only want to log the entries till the INFO level, you can control this as shown below:
If you want to debug the application and log entries for DEBUG loggers, set the log level to DEBUG to allow printing more diagnostic information.
Verbose and debug logging
Verbose and debug logging in MuleSoft provides deeper visibility into how Mule flows and components behave at runtime.
Debug logging is commonly used to trace application logic and understand how data flows through Mule components. When enabled, debug logs capture detailed information, including payload values, variable states, processor execution order, and connector requests and responses. This level of logging is especially useful when diagnosing functional issues, validating transformations, or identifying integration errors. Enabling debug logs can degrade application performance and create overhead; always ensure they are turned off after debugging.
Verbose logging goes a step further by capturing extremely detailed internal runtime information, including low-level framework operations, threading behavior, and transport-level details. While verbose logs can be invaluable when working with MuleSoft support or investigating complex runtime issues, they significantly increase log volume and can impact application performance. For this reason, verbose logging is typically enabled only for short durations and under controlled conditions.
To enable deeper logging for application modules, locate the package names for connectors or modules in the project. You can expand the relevant package to view them.
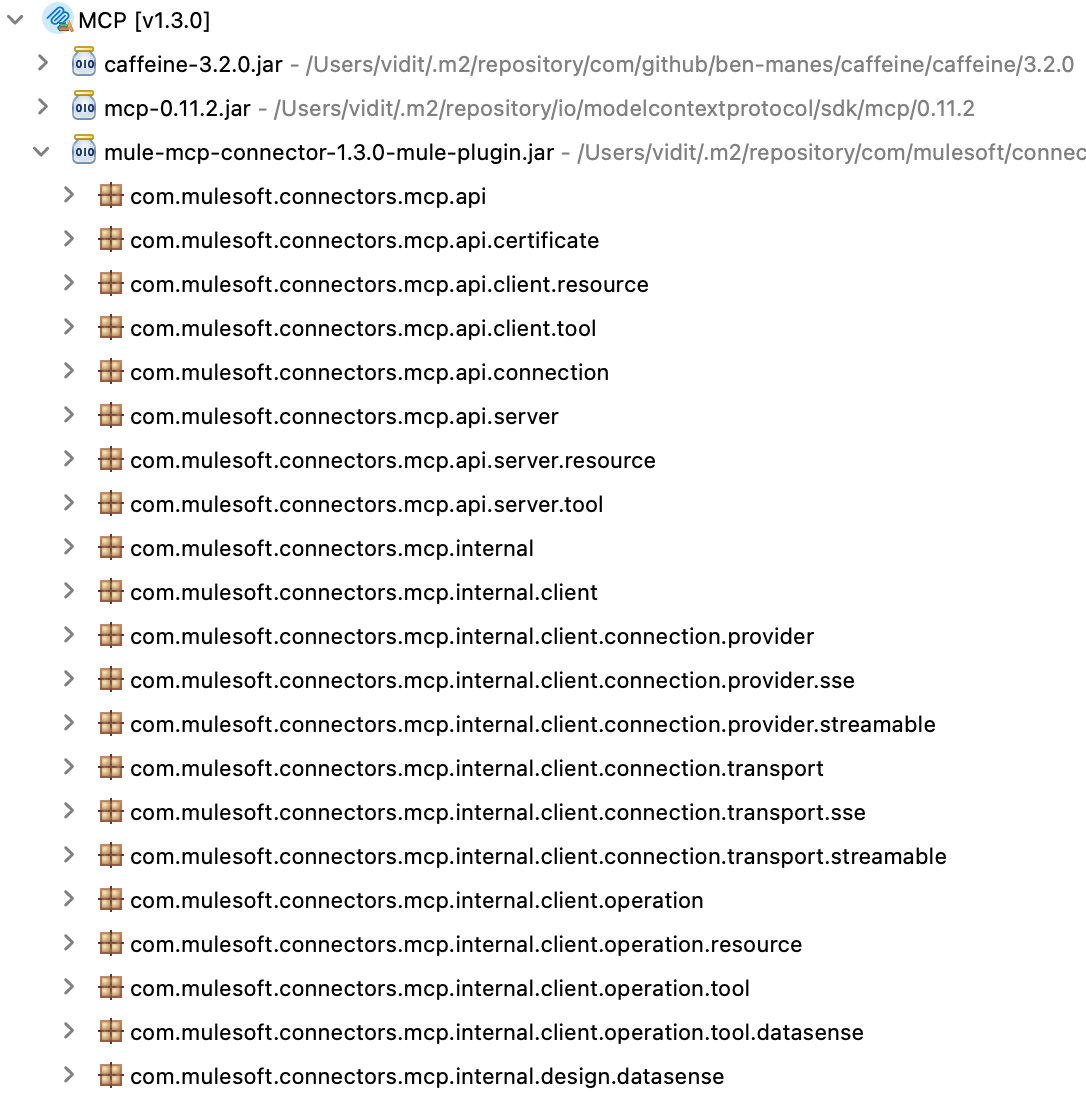
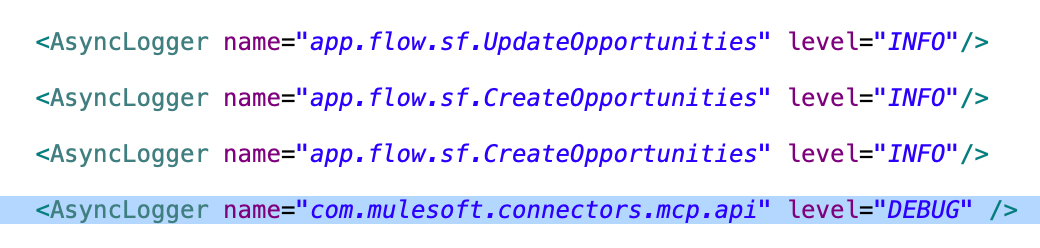
To enable verbose logging for a package or component in the Mule application, add an entry in the log4j configuration file for the package you want to log, and set the log level to DEBUG or the desired category. The code below shows the entries for different logging categories, allowing you to control the log level as required.
Example of enabling HTTP verbose logging
Let’s look at an example to enable verbose logging for HTTP traffic in MuleSoft. Verbose logging can be very helpful when you need to debug issues specific to the connectors.
The package name to enable verbose logging for HTTP traffic is:
org.mule.service.http.impl.service.HttpMessageLogger
This package is used by connectors that make HTTP requests in MuleSoft, such as the HTTP, Web Service, and Salesforce connectors (which use SF REST APIs).
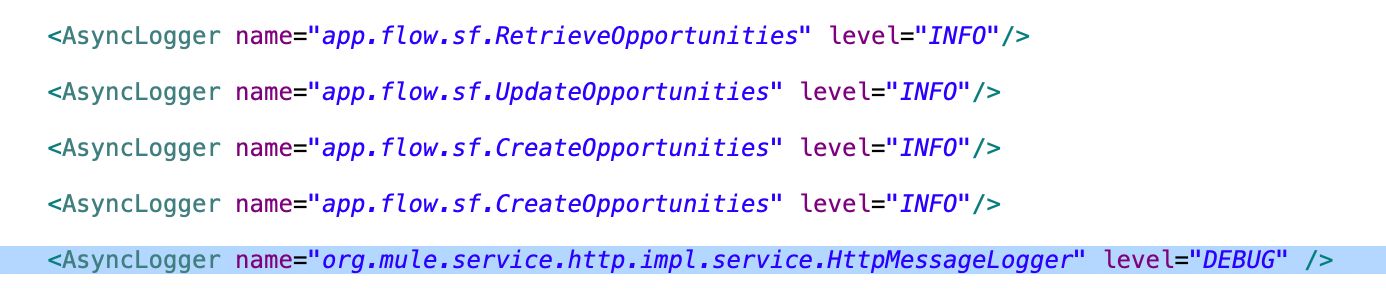
To enable debug logs for HTTP, add the HTTP Message logger config and set the level to DEBUG. Once enabled, all HTTP traffic is logged in DEBUG mode as well providing more diagnostic information.
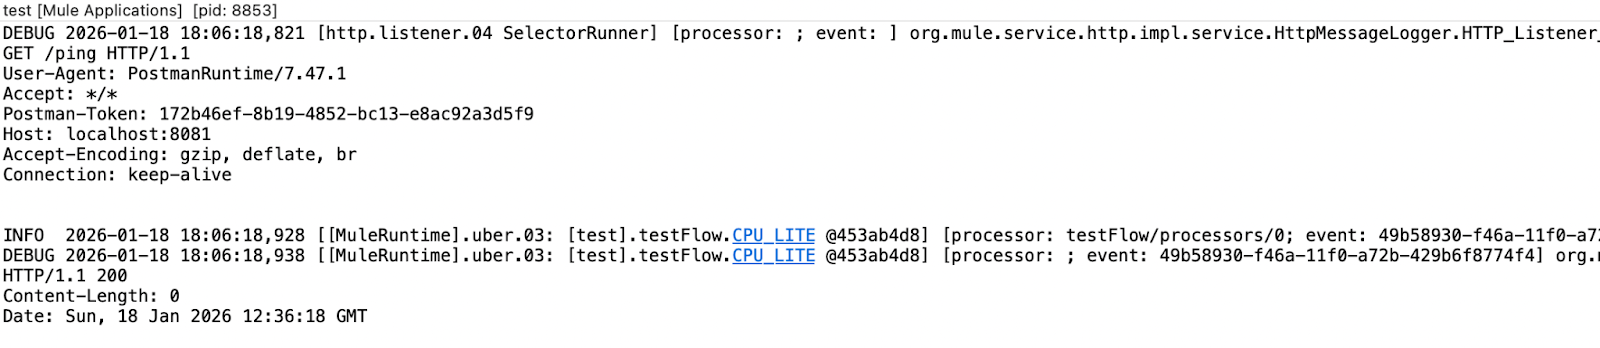
When the application receives an HTTP request with verbose logging enabled, it prints all information, including the request headers and the input payload.
Enabling verbose logging via CloudHub
You can also control the logging level from CloudHub. Under the logging tab, add the package name and set the desired log level. This provides more granular control—you can set the log level for a package in specific environments. For example, if debug logging is required only in the test environment, the log level can be set to DEBUG there without changing the code.
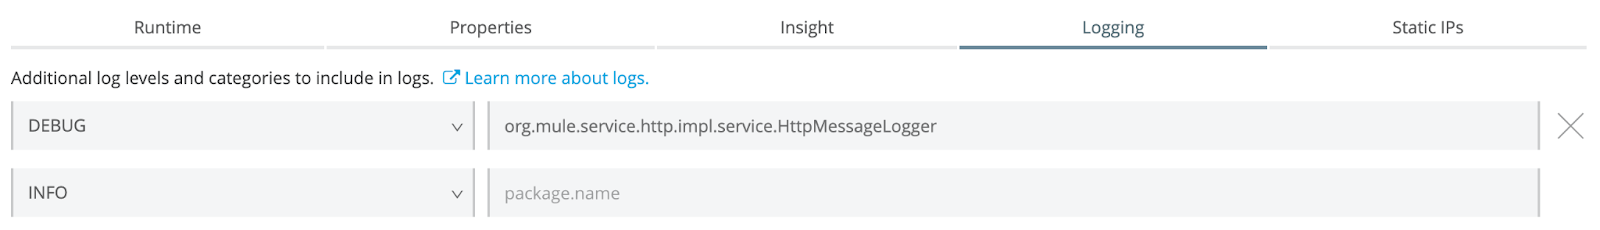
The snapshot above shows the application deployed to CloudHub and the HTTP message logger set to DEBUG.
Message Logging Policy
A message logging policy in MuleSoft enables developers to log API traffic at the gateway level, independent of Mule application code. It executes before or after request processing and is centrally managed through the API Manager.
The policy records request and response metadata such as resource path, HTTP method, status codes, and correlation identifiers, with optional payload logging. Because the policy runs outside the application flow, it enforces uniform logging standards across APIs and consumers.
To enable the message logging policy for a MuleSoft application:
Navigate to the API for which the policy needs to be applied in the API Manager -> Go to policies and select the Message Logging Policy.
The policy provides the following parameters for configuration:
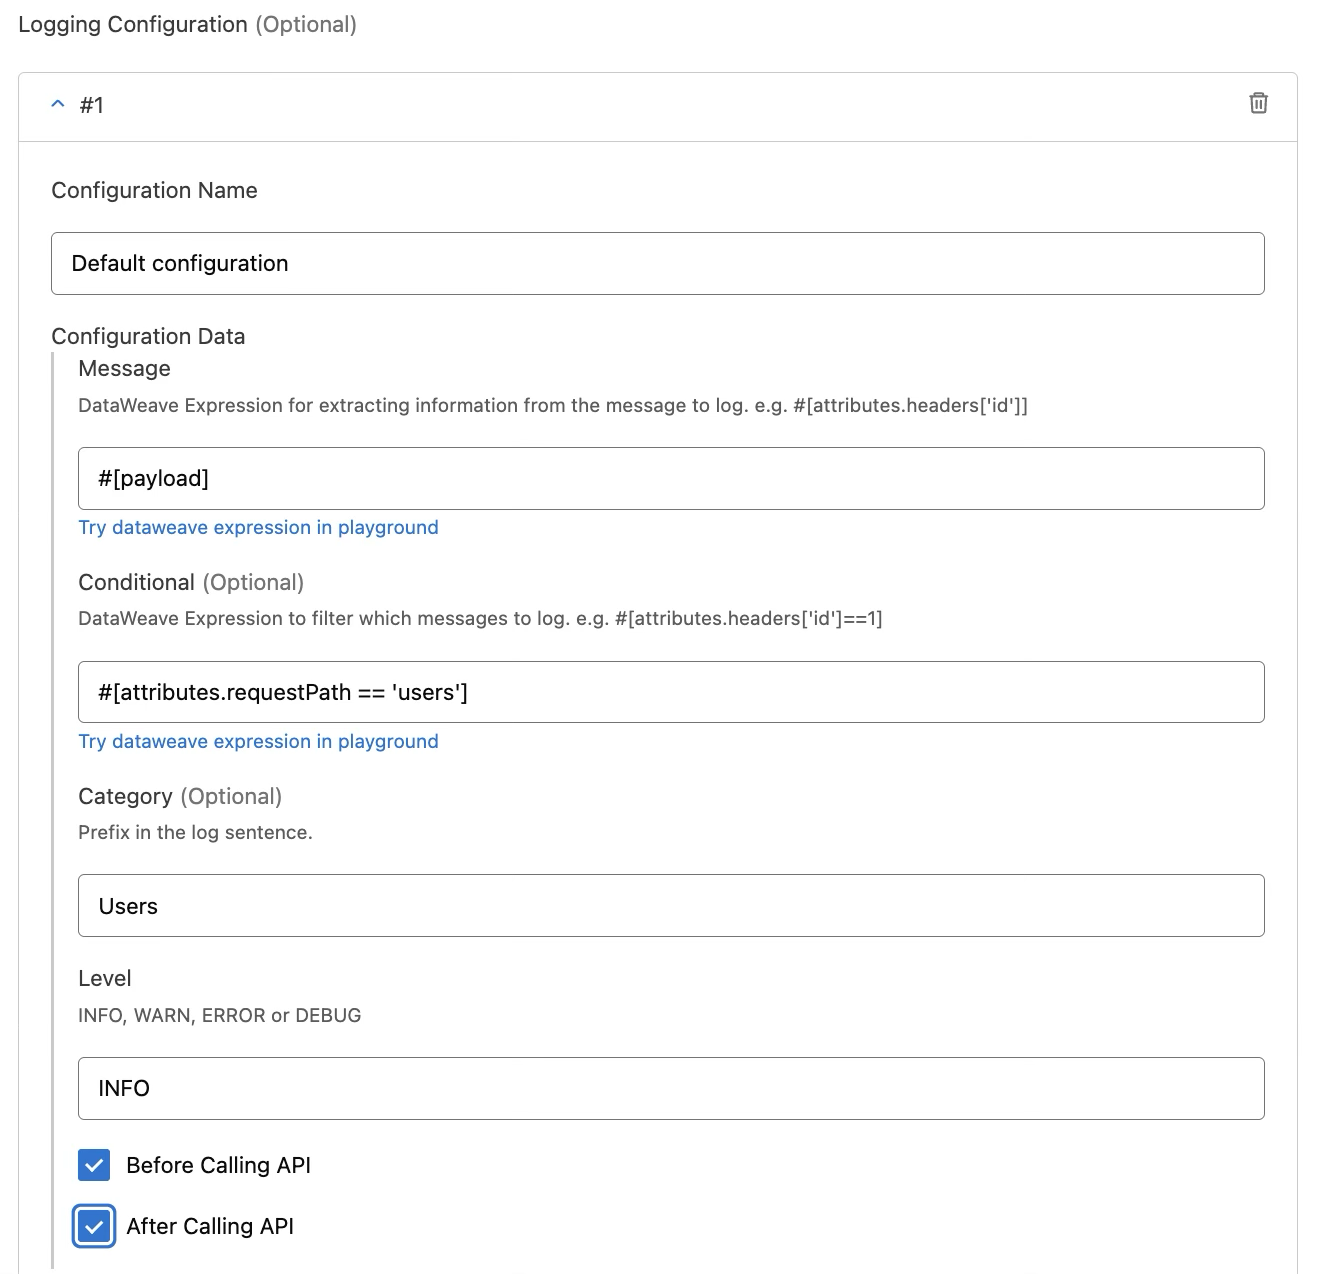
Once the policy is applied to an application, every request that meets the message logging criteria is captured as configured.
Message logging policy should be used for operational monitoring, incident analysis, and compliance, not for business-level tracing. When used correctly, message logging policy can provide essential operational visibility while preserving performance, security, and clean application design.
Mapped Diagnostic Context (MDC) logging
MDC logging in MuleSoft can add context and information to individual log messages. MDC enhances logging by enabling the addition of values such as IDs, correlation IDs, or custom attributes to logs, which can be used to track a single request across multiple flows and systems. MDC logging is especially valuable in distributed, asynchronous integrations, where tracking execution paths can otherwise be difficult.
Let’s take an example of an account record being updated in a downstream system. The downstream system doesn’t know the request's correlation ID in MuleSoft. If you need to track a request using the record's account ID across MuleSoft and the downstream system, you can only do so if the account ID is logged with every logger processor. MDC solves this problem by enabling the addition of key-value pairs to loggers, ensuring that this data remains available for all log messages generated on the same thread during the lifecycle of a logging event.
Configuring MDC logging via the tracing module
MuleSoft has an out-of-the-box tracing module that can be used to set, remove, or clear logging variables. To enable MDC logging in MuleSoft, the log4j configuration must be updated first. Update the pattern layout of the RollingFile appender in the log4j2 file to adhere to the MDC logging pattern. This pattern defines how each log message is formatted before it is written to the log output.
<PatternLayout pattern="%-5p %d [%t] [%MDC] %c: %m%n" />
Let’s look at what each part of the expression means:
- %-5p prints the log level (INFO, ERROR, DEBUG, etc.), left-aligned and padded to 5 characters.
- %d adds the timestamp for when the log event occurred.
- [%t] displays the thread name that generated the log message.
- [%MDC] outputs values stored in the mapped diagnostic context, such as correlation IDs or transaction identifiers.
- %c shows the logger name or category, indicating the source of the log.
- %m prints the actual log message.
- %n inserts a new line after each log entry.
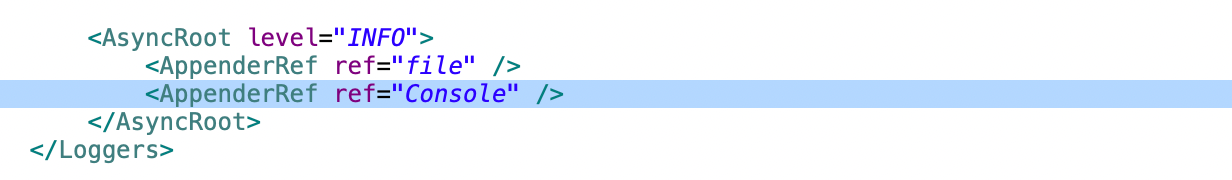
This layout produces structured, readable log entries that include severity, timing, execution context, correlation data, and source. To follow the same logging pattern in the console, you can add a new appender for the console and enable async logging for the same.
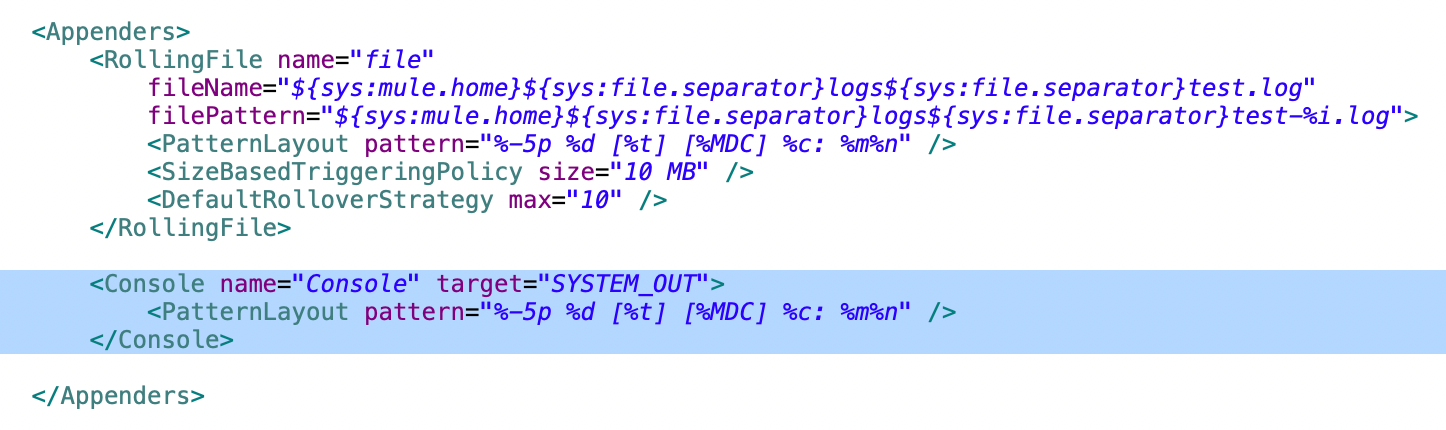
Add the AsyncRoot tag for the console appender to enable asynchronous logging at the root level of the application.
Once the log4j configuration is correct, we can set up tracing variables in the flow. You can add multiple tracing variables by using the Set Logging Variable processor from the tracing module. The example flow adds a DB Account ID variable to track the request.
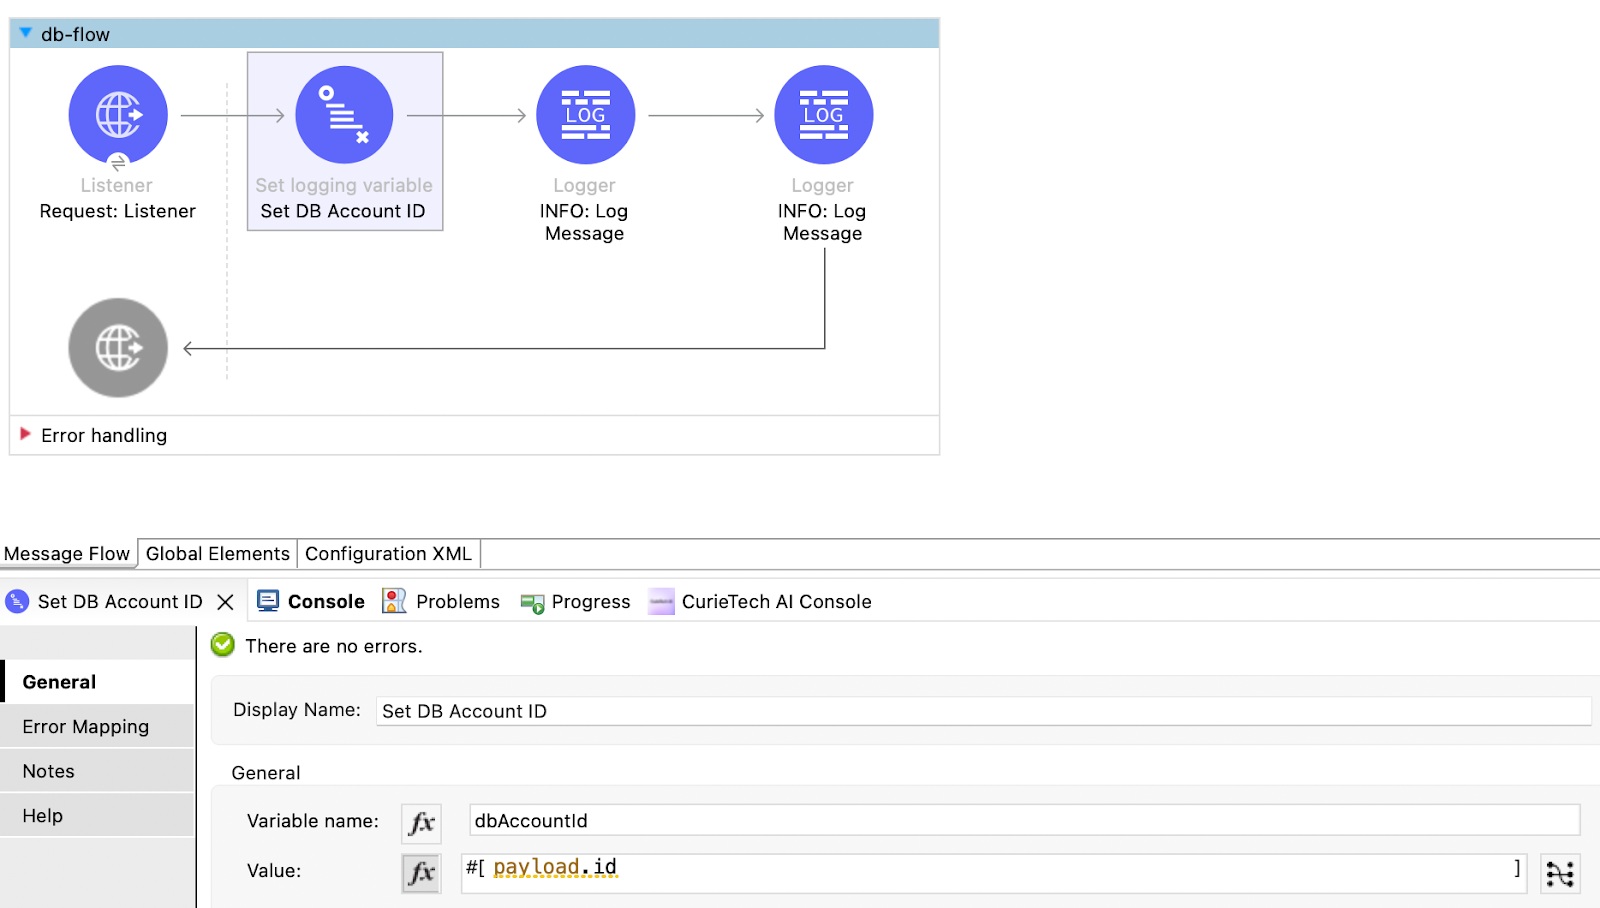
Once the flow is set up and run, all loggers in the flow log the added context variables. This ensures flexibility while logging messages to the runtime and also provides enhanced visibility into every request.

The snapshot above shows correlationId, dbAccountId, and processorPath logged alongside the log message when MDC is enabled. correlationId is the event's correlation ID, and processorPath is the location of the current event; both are added to Mule MDC by default.
{{banner-large="/banners"}}
Custom Logging using JSON Logger
As Mule applications grow in complexity, logging becomes more than just writing messages to a file. Teams need logs that are consistent, easy to search, and rich enough to explain what actually happened during a transaction. This is where custom logging with the JSON Logger becomes valuable. Instead of relying on unstructured text logs, JSON Logger produces structured, context-aware logs that are well-suited for modern monitoring and observability tools.
Benefits of JSON Logger
Here are some benefits of using JSON logger with Mule applications:
Structured and consistent logging
JSON Logger produces logs in a well-defined JSON structure rather than unstructured text. This enforces consistency across applications and environments, making logs predictable, easier to parse, and suitable for automated processing.
Improved observability and traceability
By capturing contextual fields such as correlation IDs, flow names, processor locations, timestamps, and custom business identifiers, JSON Logger enables end-to-end transaction tracing across distributed integrations and downstream systems.
Seamless integration with log analytics platforms
JSON-formatted logs are natively compatible with centralized logging and monitoring tools like ELK, Splunk, and cloud-native observability platforms. This allows teams to build meaningful dashboards, run precise queries, and set up alerts without additional log transformation.
Greater control over logged data
JSON Logger provides fine-grained control over what is logged, including selective fields, dynamic metadata, and sensitive information masking. This helps balance debugging needs with security, compliance, and data privacy requirements.
Publishing the JSON Logger to Exchange
Before publishing the JSON logger to the exchange, create a connected app with the Exchange Administrator scope to ensure it has permissions to publish assets to the organization's exchange.
- Clone or download the JSON logger repository from GitHub.
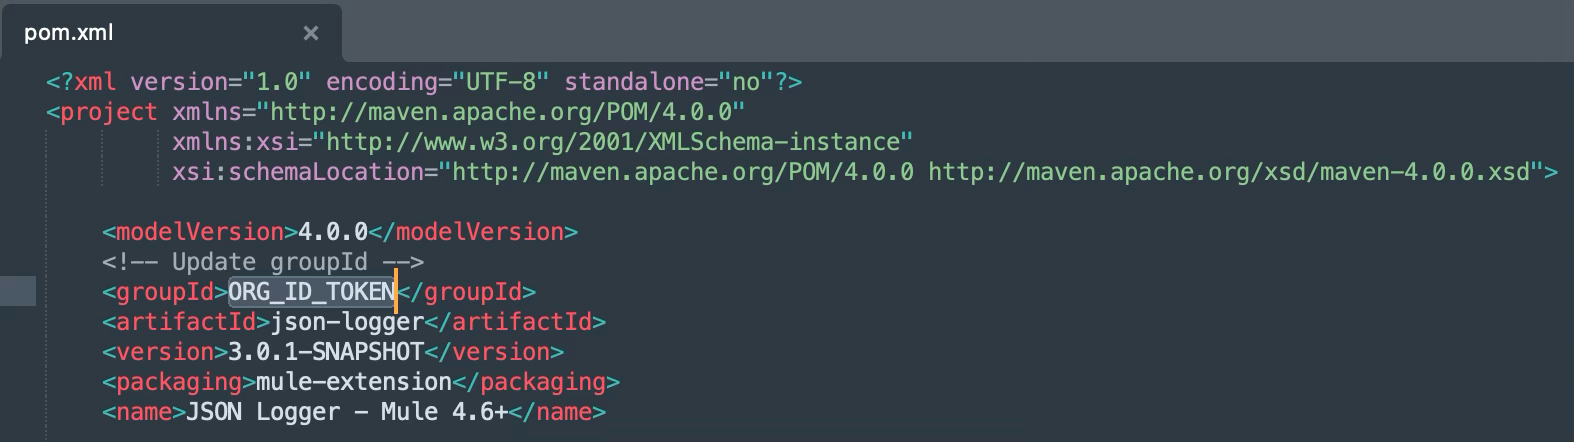
- Extract the downloaded ZIP and open the POM file inside the JSON logger folder.
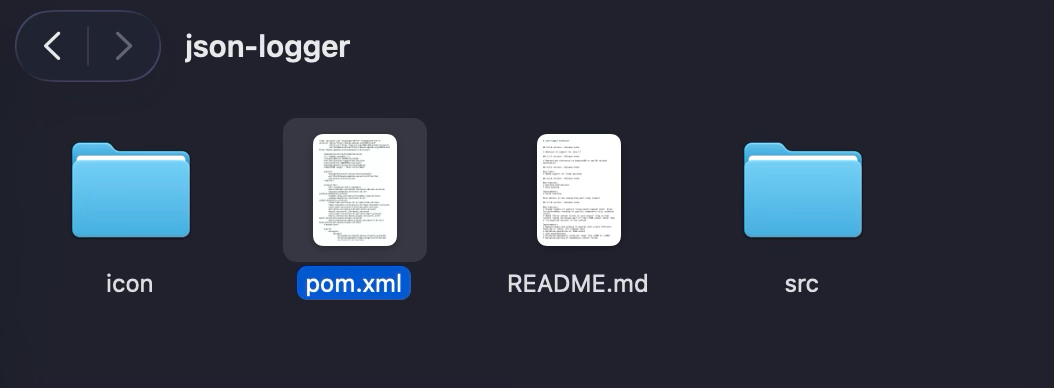
- Replace the ORG_ID_TOKEN value inside the groupId tag with the organization ID of the business group the asset needs to be published to.
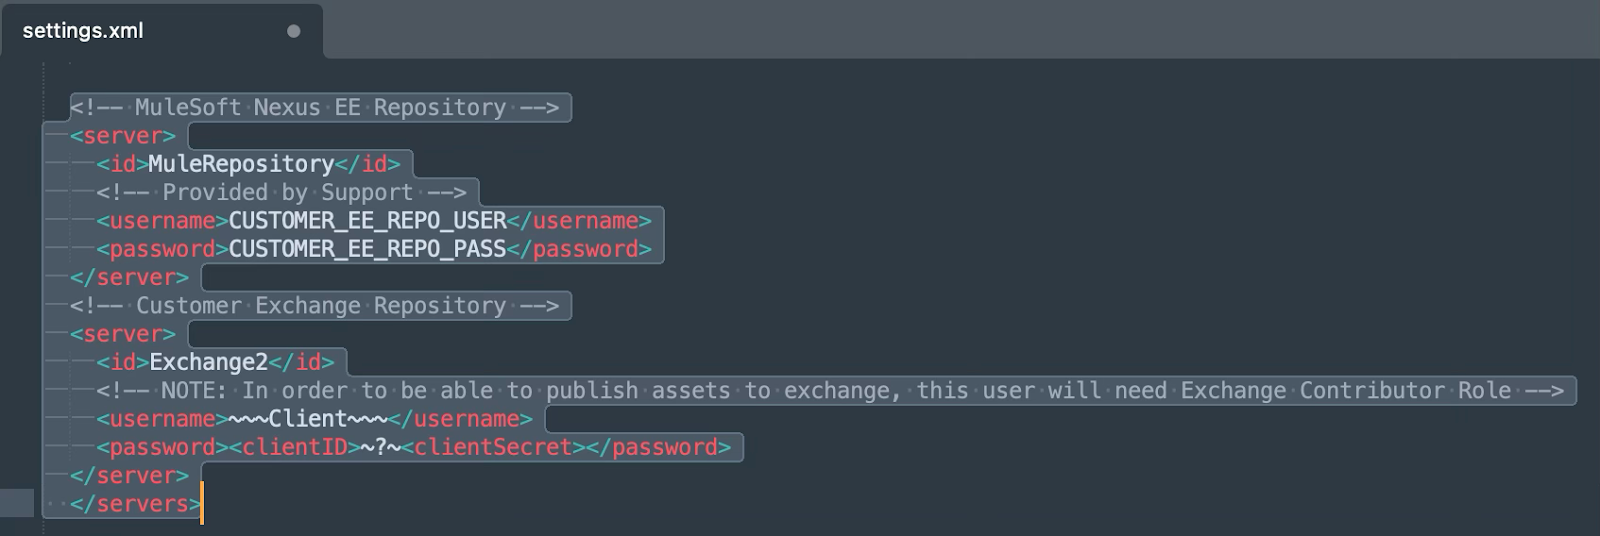
- Next, open the settings file under the root folder -> template-files. Update the values for the Mule Nexus repository credentials: username and password.
Next, update the credentials for the exchange; these should be the credentials from the connected app.
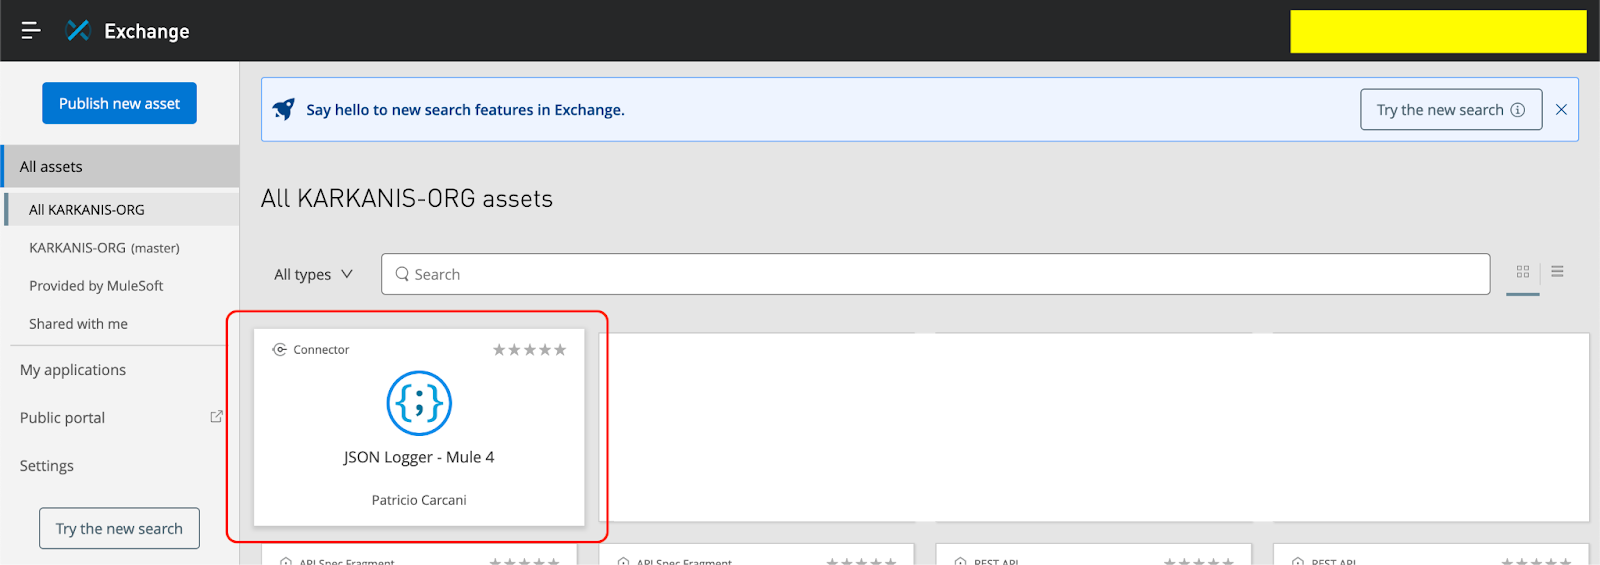
- The setup to publish the asset is now complete. To publish the asset to the exchange, navigate to the JSON logger root folder -> json-logger and execute the following command.
mvn deploy --settings ../template-files/settings.xml
Adding JSON Logger in applications using CurieTech AI
At this point, the JSON logger is ready to be used in Anypoint Studio. You can use CurieTech AI to add the JSON logger to your existing or new projects.
Let’s illustrate using the JSON Logger in Mule flows using CurieTech AI. You can upload your application and ask Curie to add JSON logging to the flow.
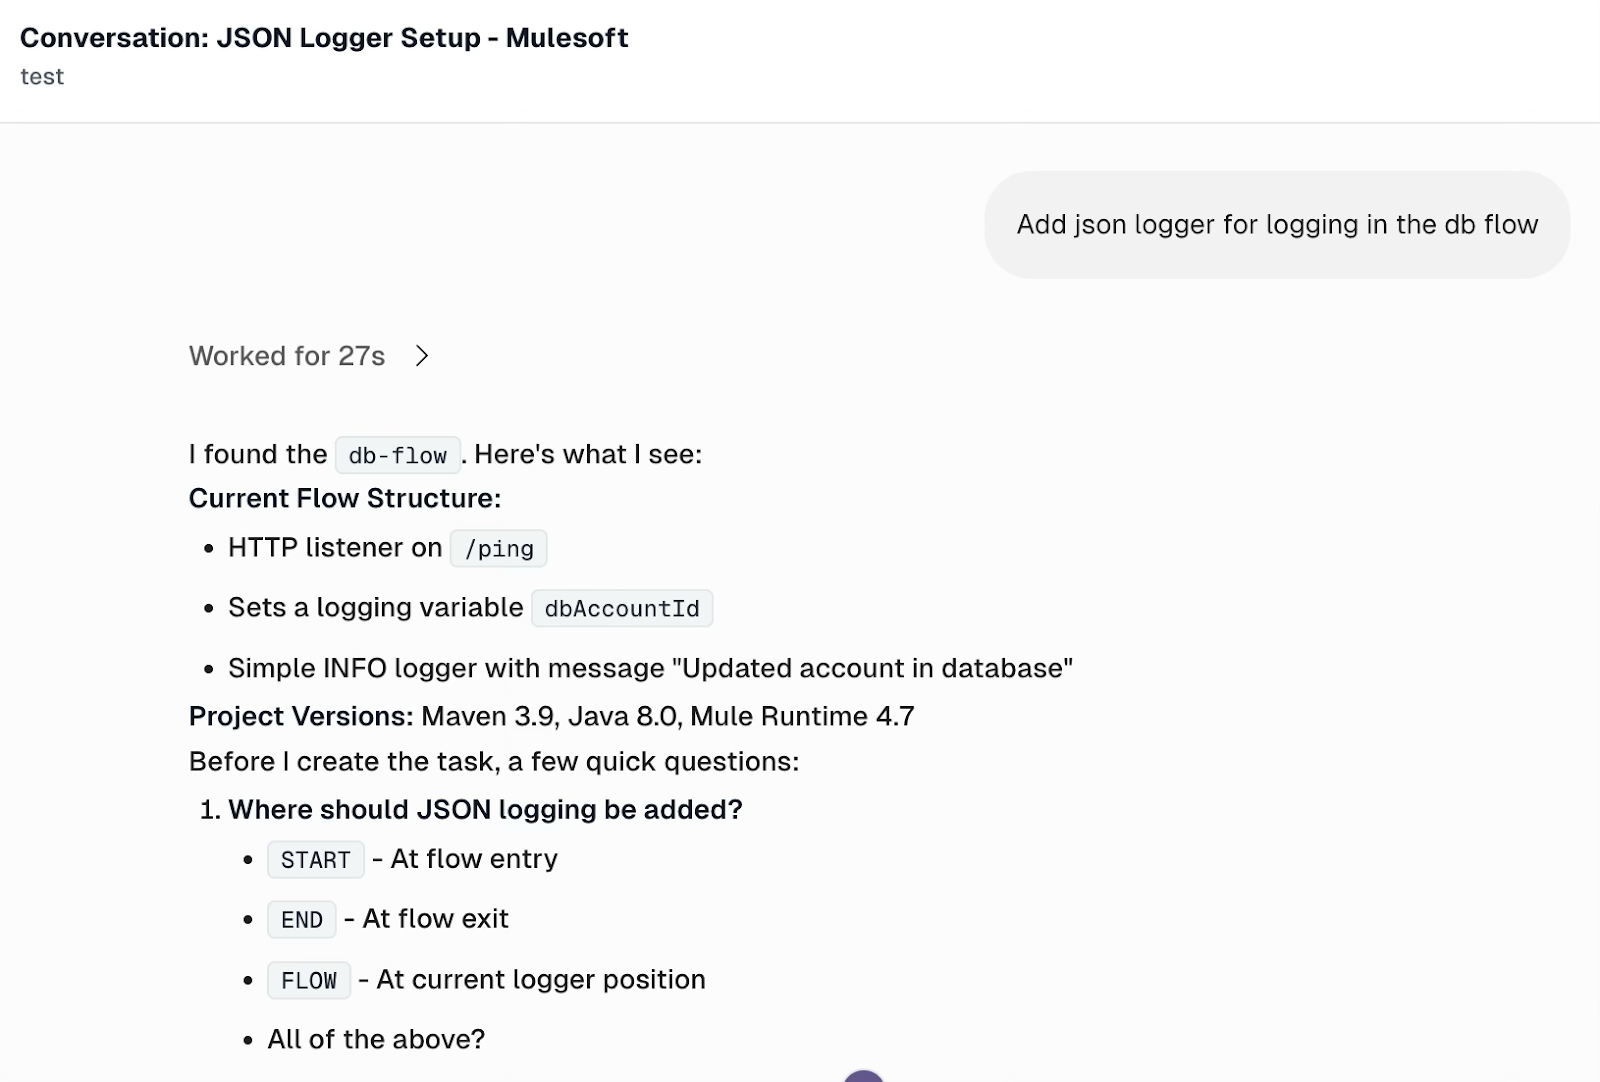
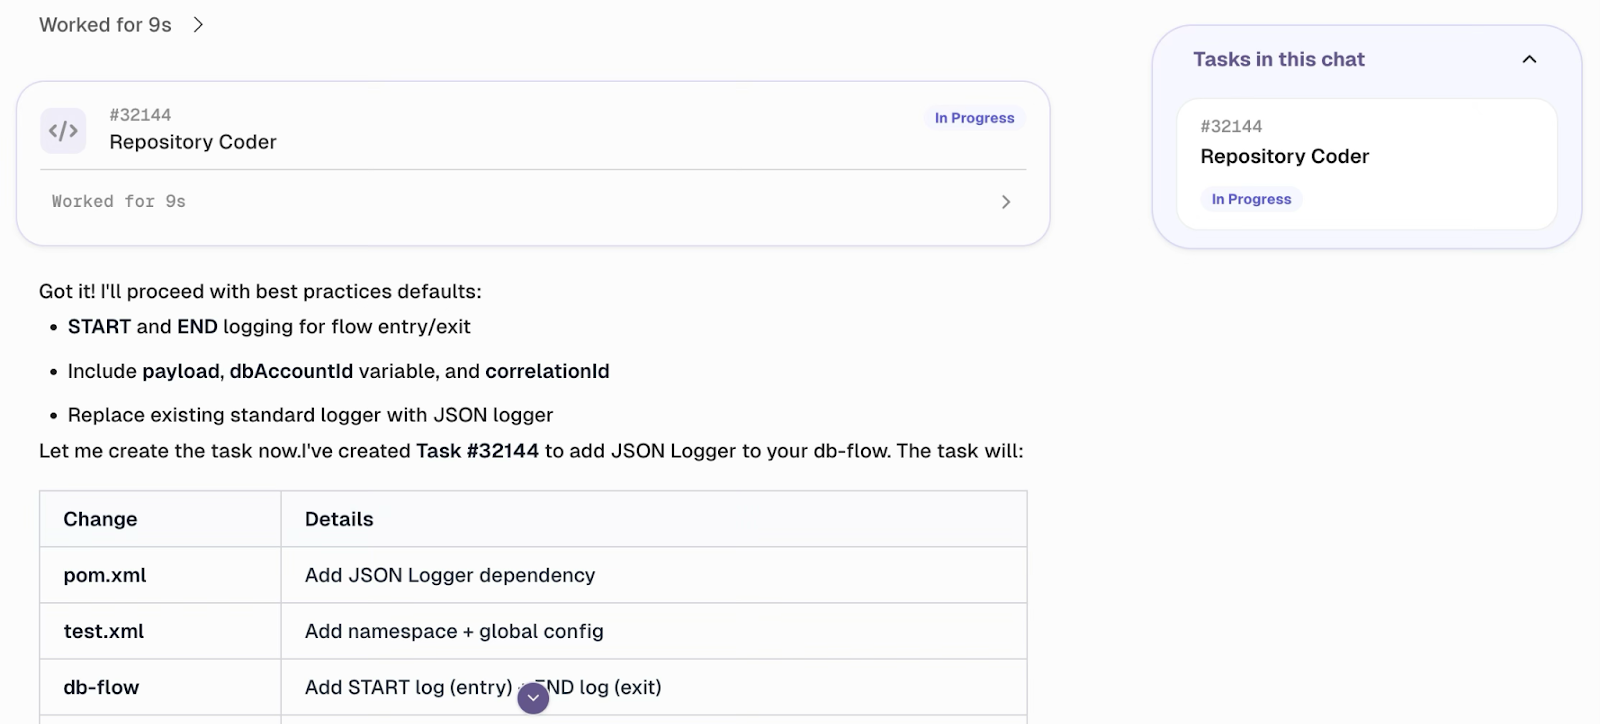
Curie creates a Repository coder task to add a JSON logger to the provided project.
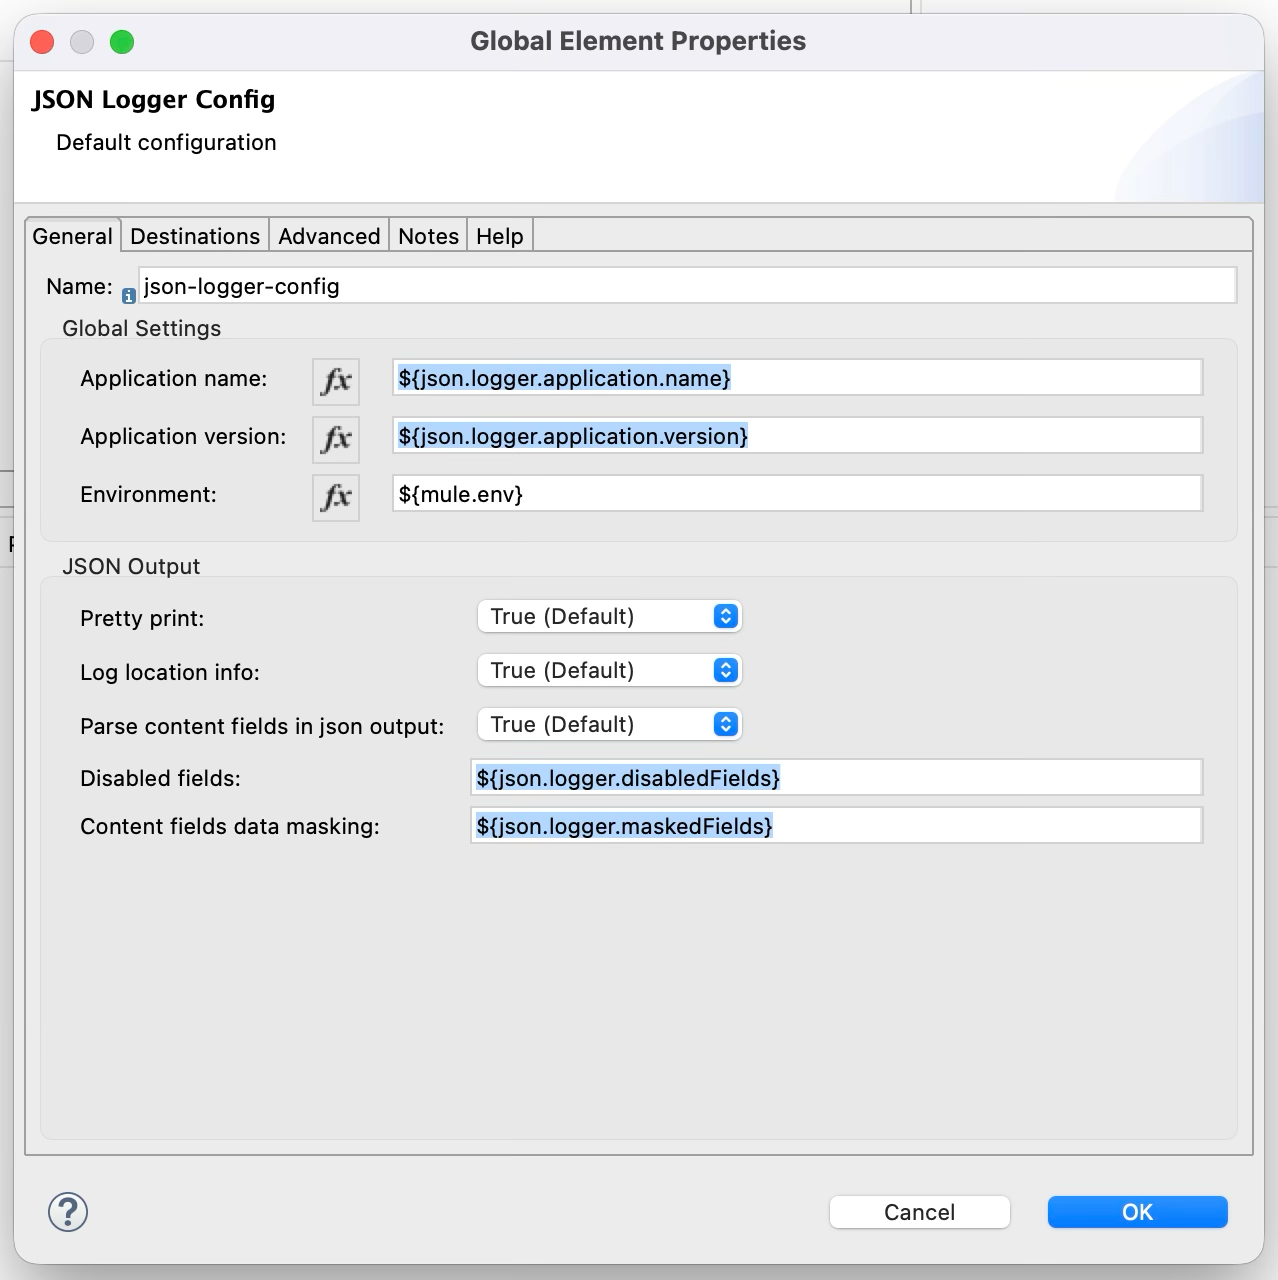
Here is a screenshot of the JSON logger configuration provided by Curie, including application name, application version, environment, disabled fields, and fields that require masking when printed.
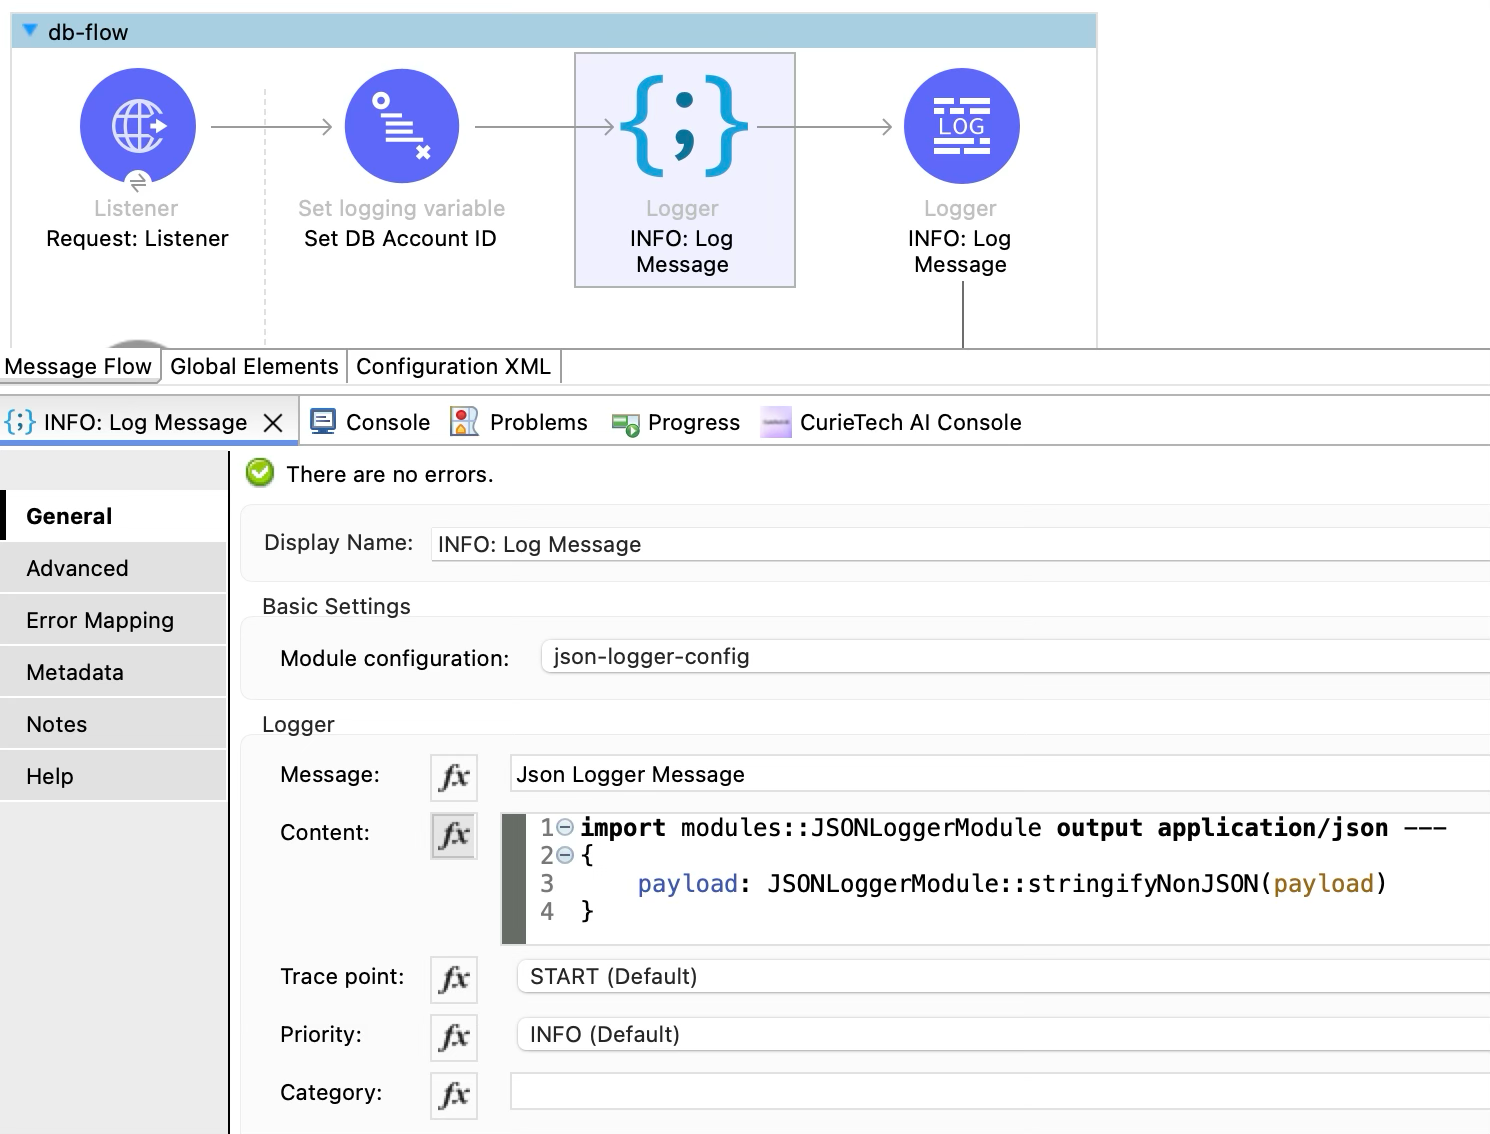
JSON Logger allows configuring trace points based on where the logger is used in the application flow. The screenshot below shows a JSON logger in the Mule application generated by Curie.
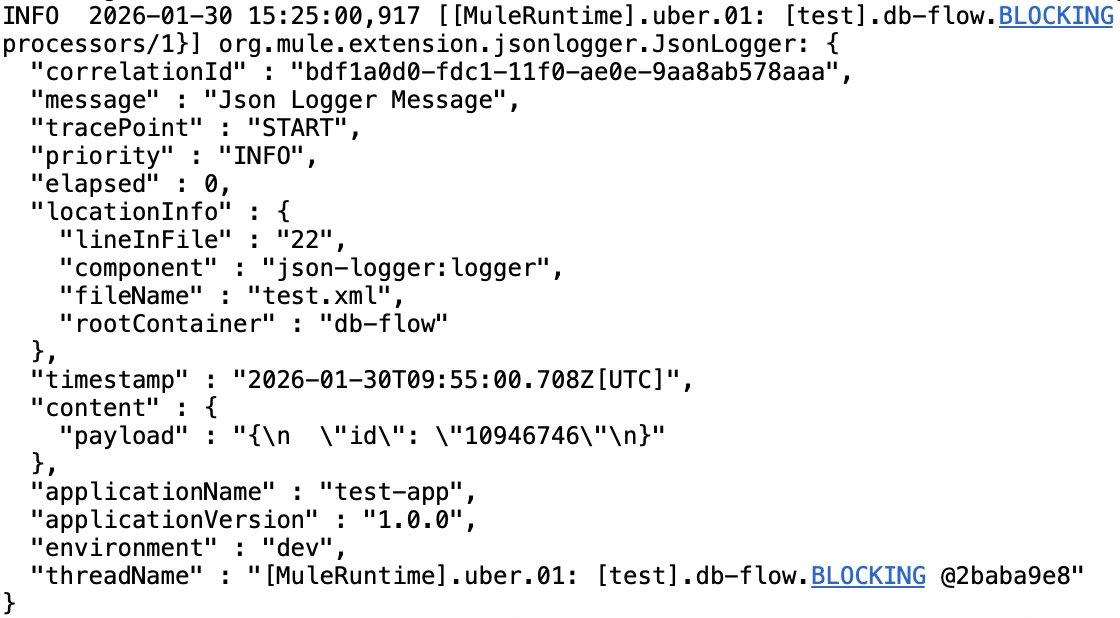
When the application runs, all the logs are printed in JSON format. Here is an example JSON log entry from the Mule application.
Integrating MuleSoft logs with external systems
The integration of MuleSoft logs with other systems enables teams to have a centralized view of all applications and environments. They can send MuleSoft logs to other log management systems for storage and analysis, rather than relying solely on local and CloudHub logs, enabling teams to gain a better view of both application health and transaction tracing.
MuleSoft provides support for external logging through Log4j2 appenders and platform integrations, enabling the streaming of logs to centralized logging or monitoring tools. External logging enables teams to correlate MuleSoft events with logs from other systems, trigger alerts, and meet auditing or compliance requirements.
Configuring Splunk with MuleSoft logging
A common use case is forwarding MuleSoft logs to Splunk for centralized analysis and monitoring. Splunk provides a dedicated SplunkHttp appender that sends logs directly to Splunk over HTTP. This appender is enabled using the com.splunk.logging package alongside the standard org.apache.logging.log4j framework.
In this configuration, both console logging and Splunk forwarding are enabled. Console logs continue to appear in CloudHub for real-time visibility, while the same log events are asynchronously forwarded to Splunk for centralized storage and analysis.
The configuration uses environment variables and system properties, such as the application name, pod name, Splunk host, and authentication token. This approach allows the same Log4j2 configuration to be reused across environments without hardcoding sensitive or environment-specific values.
<?xml version="1.0" encoding="UTF-8"?>
<Configuration status="INFO" name="cloudhub" packages="com.splunk.logging,org.apache.logging.log4j">
	<Appenders>
		<Console name="CONSOLE" target="SYSTEM_OUT">
			<PatternLayout pattern="[%d{MM-dd HH:mm:ss}] %-5p %c{1} [%t]: %m%n"/>
		</Console>
		<SplunkHttp name="SPLUNK"
        	source="${env:APP_NAME}"
        	host="${env:POD_NAME}"
        	sourceType="mule-app"
            url="${sys:splunk.host}"
            token="${sys:splunk.token}"
            index="main">
			<PatternLayout pattern="[%d{MM-dd HH:mm:ss}] %-5p %c{1} [%t]: %m%n" />
		</SplunkHttp>
	</Appenders>
	<Loggers>
		<AsyncRoot level="INFO">
			<AppenderRef ref="CONSOLE"/>
			<AppenderRef ref="SPLUNK"/>
		</AsyncRoot>
	</Loggers>
</Configuration>
Before adding this configuration, ensure that the Splunk logging dependency is included in the application's Maven configuration. It is also important to have a valid Splunk HTTP Event Collector (HEC) token to grant log ingestion from MuleSoft to Splunk. Note also that sensitive values such as tokens and host URLs should be externalized using system properties or secure configuration management.
When implemented correctly, external log integration provides MuleSoft teams with powerful operational visibility, improved troubleshooting capabilities, and a scalable foundation for monitoring and compliance.
Here’s how this configuration works:
- Logs are written to the console, making them visible in CloudHub.
- The SplunkHttp appender forwards the same logs to Splunk over HTTP.
- The AsyncRoot logger ensures that logging is handled asynchronously, reducing performance impact on Mule flows.
- The root log level is set to INFO, capturing standard operational messages while avoiding excessive verbosity in production.
Using CurieTech AI to generate an external logging configuration
CurieTech AI is an AI-powered platform developed and trained specifically for MuleSoft. The platform provides a host of agents, such as Coder for generating and updating MuleSoft applications based on prompts, Dataweave Generator for generating DataWeave scripts, testing agents for generating MUnit test cases, and documentation agents for generating documentation for MuleSoft flows. These tools help developers and teams accelerate MuleSoft development by delivering standardized, efficient, and consistent code.
The previous topic covered the forwarding of MuleSoft logs to Splunk via Log4J. Let’s extend this to incorporate logs from the ELK stack using CurieTech AI. The following is a snapshot of a prompt to create the configuration for the forwarding of MuleSoft logs to ELK.
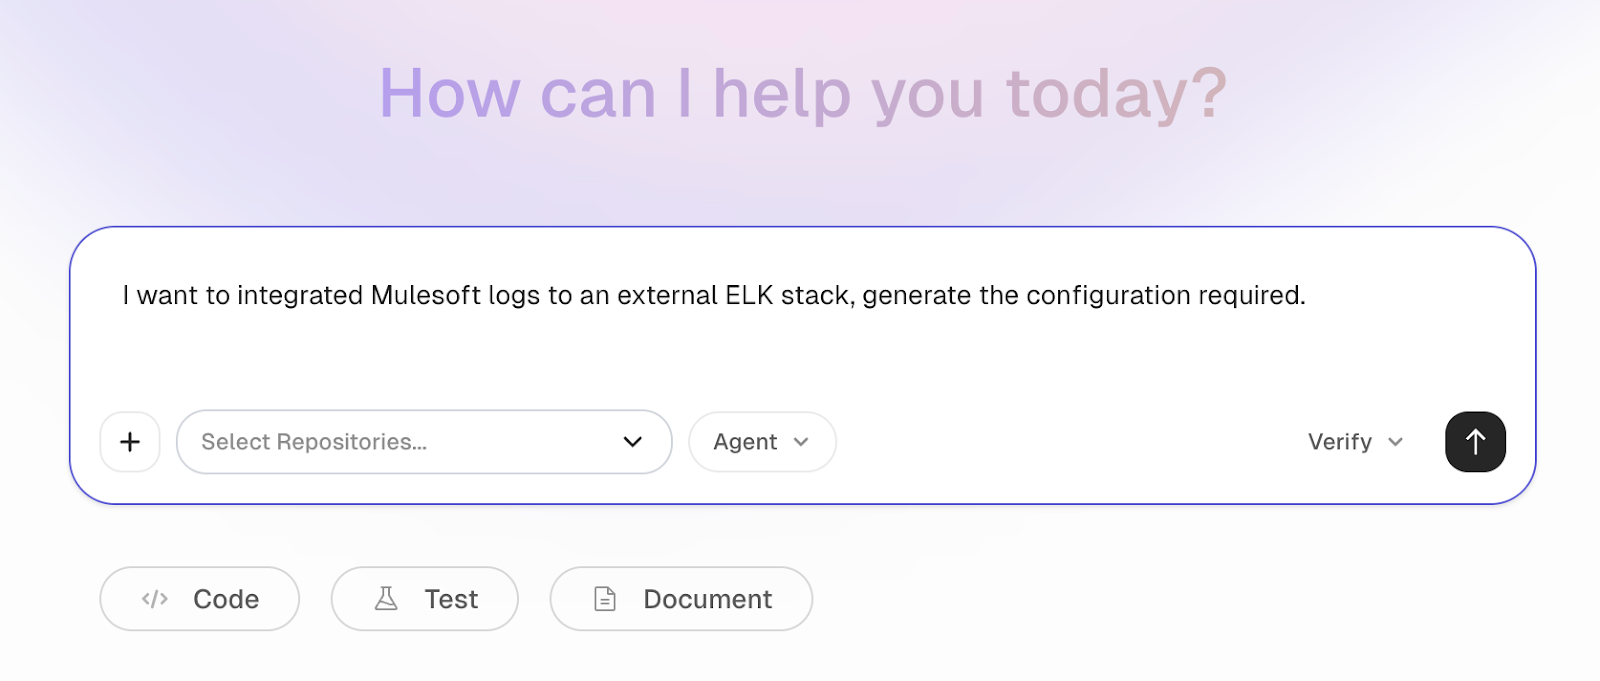
CurieTech AI understands the prompt and generates the Log4J2 configuration for forwarding logs to ELK. It includes appenders for both CloudHub and on-premises environments, along with the configuration packages required to support the integration. The agent also ensures that all properties are externalized for secure, environment-based usage.
The key benefits of this approach include faster, more consistent external logging setup, reduced manual errors, and configurations that align with best practices across environments.
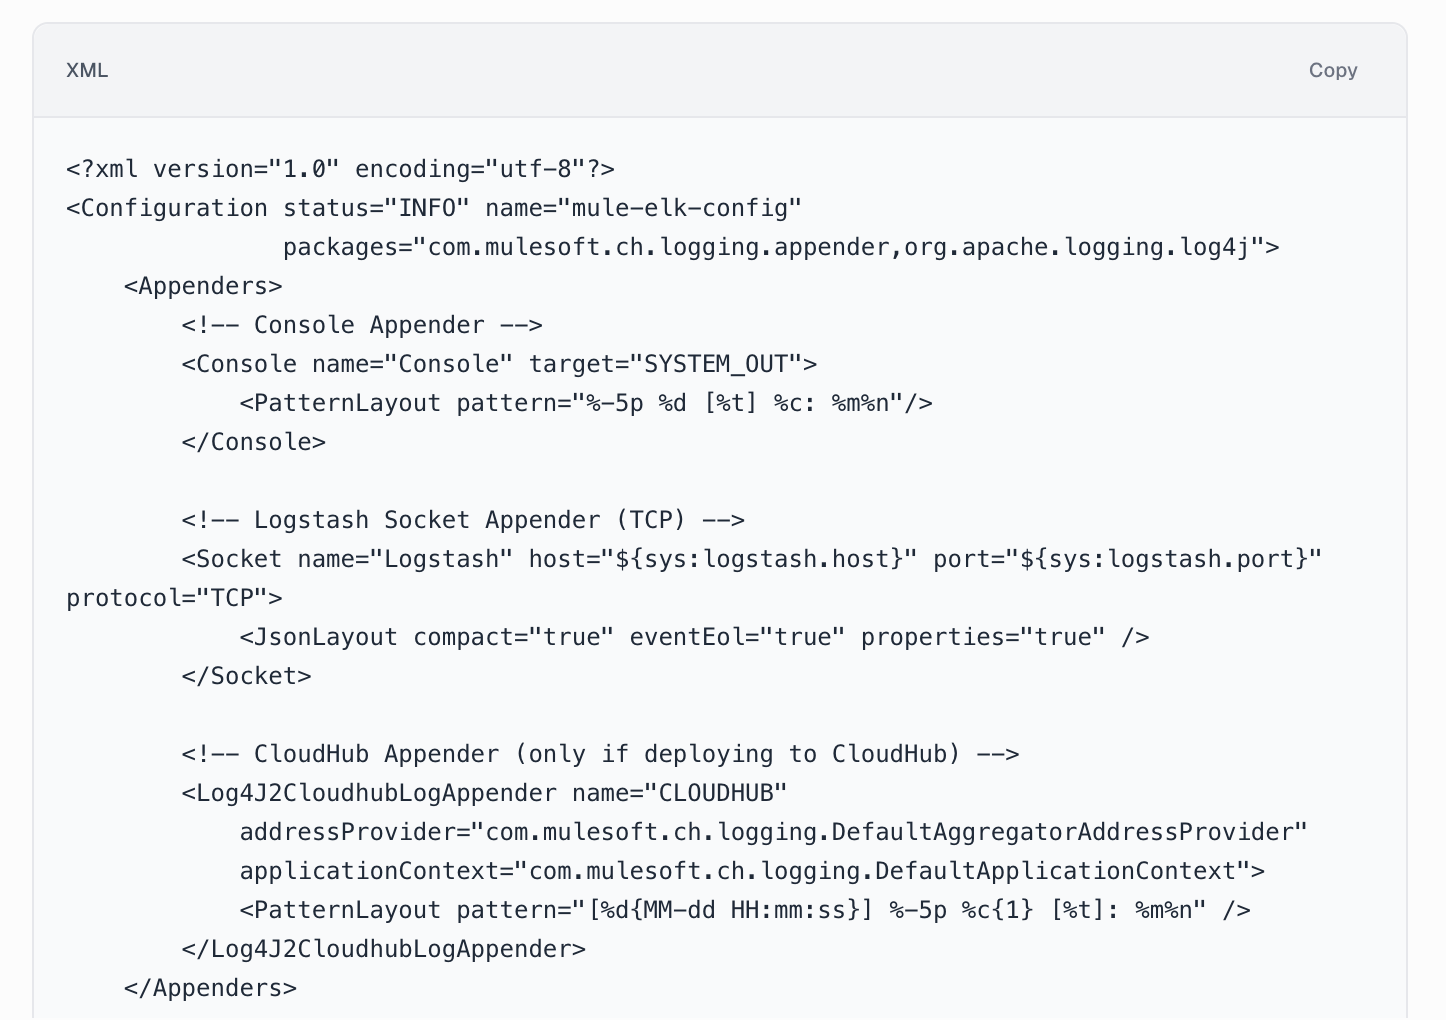
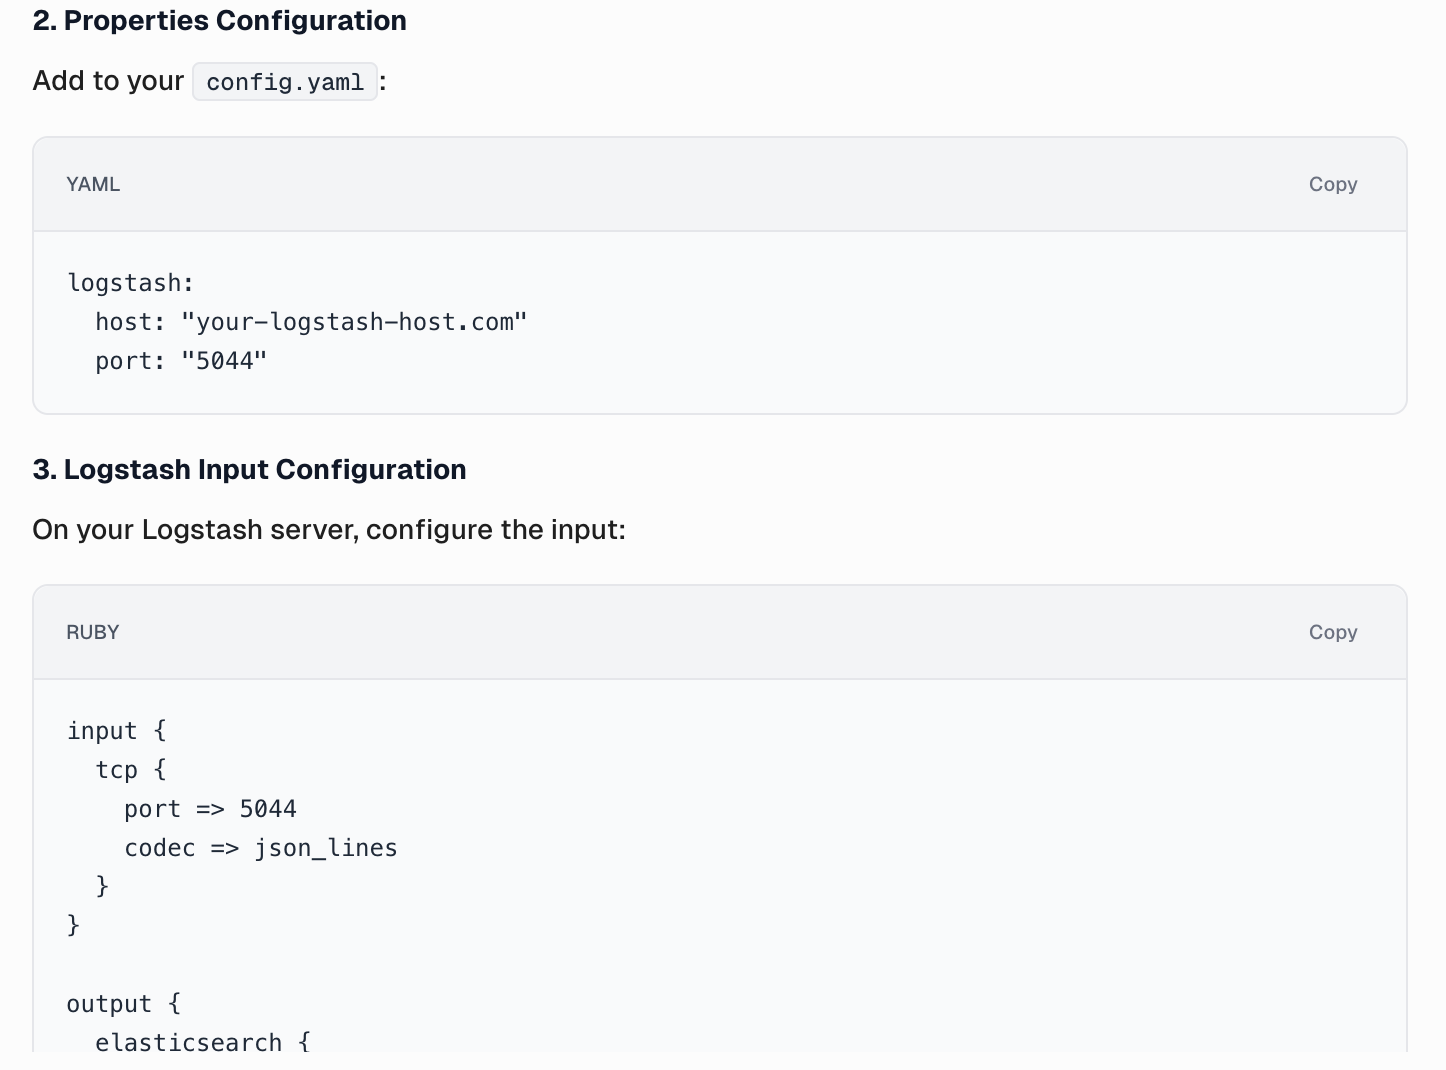
CurieTech AI also provides the Log4J2 configuration properties being used in the appender configuration to ensure the sensitive properties are externalized and configurable externally. The agent also provides the configuration required on the Logstash server to enable log ingestion.
This simplifies the setup process and helps teams implement external logging quickly and correctly, even across multiple environments.
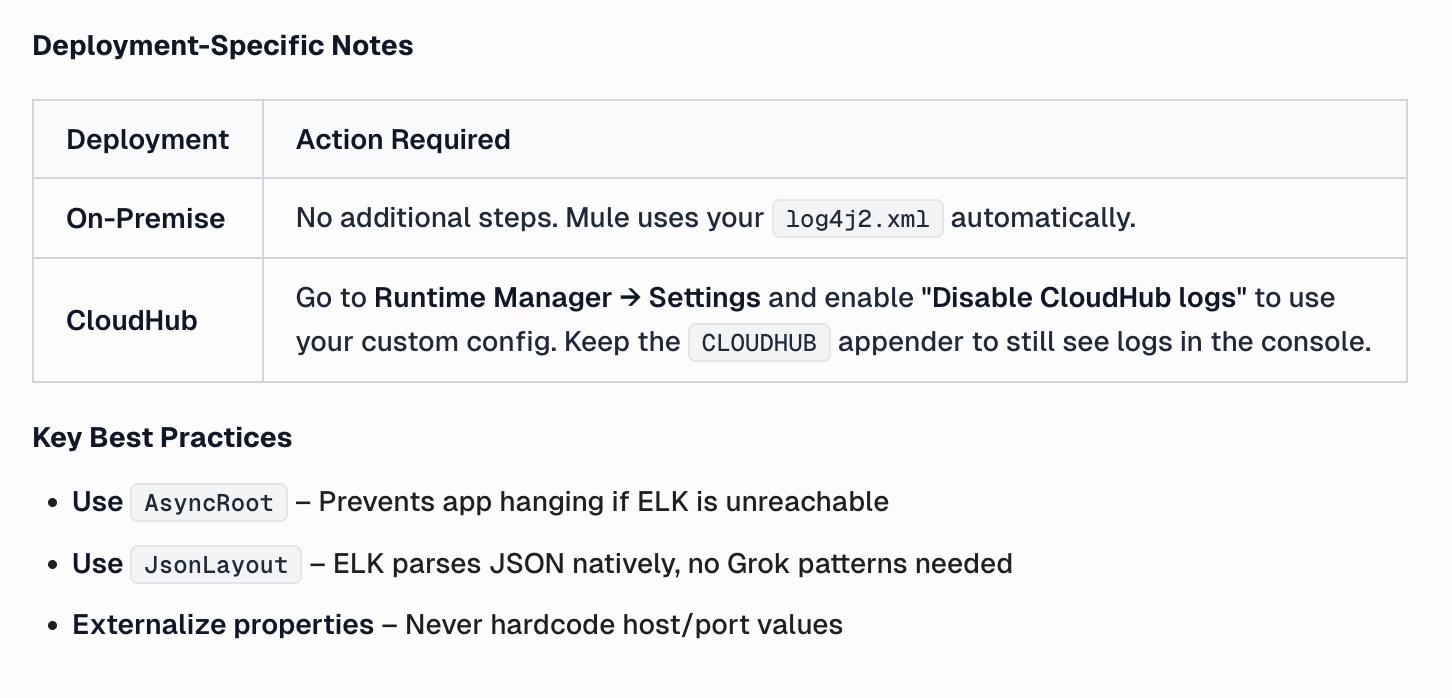
CurieTech AI generates deployment-specific notes to ensure a smooth deployment and provides explanations for some decisions.
Logging configuration in Mule applications behaves differently depending on the deployment model. In on-premise deployments, Mule automatically detects and uses the application’s custom log4j2.xml file without requiring any additional configuration. This makes on-prem setups straightforward, as the application and its runtime environment fully control the logging framework.
For CloudHub deployments, additional steps are required because CloudHub applies its own default logging configuration. To ensure that a custom log4j2.xml file is honored, the Disable CloudHub logs option must be enabled in Runtime Manager under application settings. This prevents CloudHub from overriding the custom configuration while still allowing developers to retain the CLOUDHUB appender so that logs remain visible in the CloudHub console.
Best practices
Proper logging makes it easier to support, debug, and manage Mule apps in production. Planning what to log and how to log it can provide valuable information without flooding the system or logs with unnecessary data. Standardizing log levels, loggers, and correlation data makes logs easier to understand.
Here are some best practices that ensure that logs remain reliable, secure, and valuable throughout the application lifecycle:
- Log only what is necessary: Focus on capturing meaningful events such as key processing steps, errors, and important state changes, rather than logging every operation. This keeps logs useful while avoiding excessive logging.
- Use appropriate log levels for different environments: Enable DEBUG or TRACE logging in development and testing, and restrict production logging to INFO, WARN, and ERROR to minimize performance impact.
- Selectively configure log categories to increase verbosity only for specific flows or connectors when troubleshooting: Define logging categories at a granular level—such as by package, module, or connector—so logging can be controlled precisely without impacting the entire application. Furthermore, avoid configuring too many overlapping categories, as this can lead to confusion and unintended log duplication.
- Keep category naming and log messages consistent and meaningful: This allows teams to identify the source of a log entry quickly. Ensure timely reviews and document commonly used categories for connectors and runtime components to simplify support and operational debugging.
- Avoid logging sensitive information: Do not log credentials, tokens, or personally identifiable data. Apply masking where required, and verify that logs comply with security and regulatory standards. Including correlation IDs and using MDC logging helps trace requests across flows and systems, especially in distributed integrations.
- Always prefer asynchronous logging and external log aggregation tools for production deployments: Centralized logging improves monitoring, alerting, and long-term analysis, making it easier to operate and support Mule applications at scale.
{{banner-large-table="/banners"}}
Conclusion
Logging in MuleSoft is a core functionality that affects observability and supportability. When carried out thoughtfully, logging enables developers to understand application behavior and gain insight into debugging issues. The logging framework in MuleSoft uses Log4j2, and its flexibility helps developers control logging levels, types, layouts, and output.
Integrating structured logging, asynchronous processing, MDC tracing, and third-party log integration lets teams move from runtime visibility to end-to-end tracing and centralized monitoring. By adhering to best practices for logging, one can ensure that logs are significant, secure, efficient, and not noisy or expensive. In the end, good logging design makes MuleSoft applications easier to run, scale, and support from start to finish.